Choropleth Map
Alcohol per capita consumption (aged 15 years and older) in 2010 in liters of pure alcohol
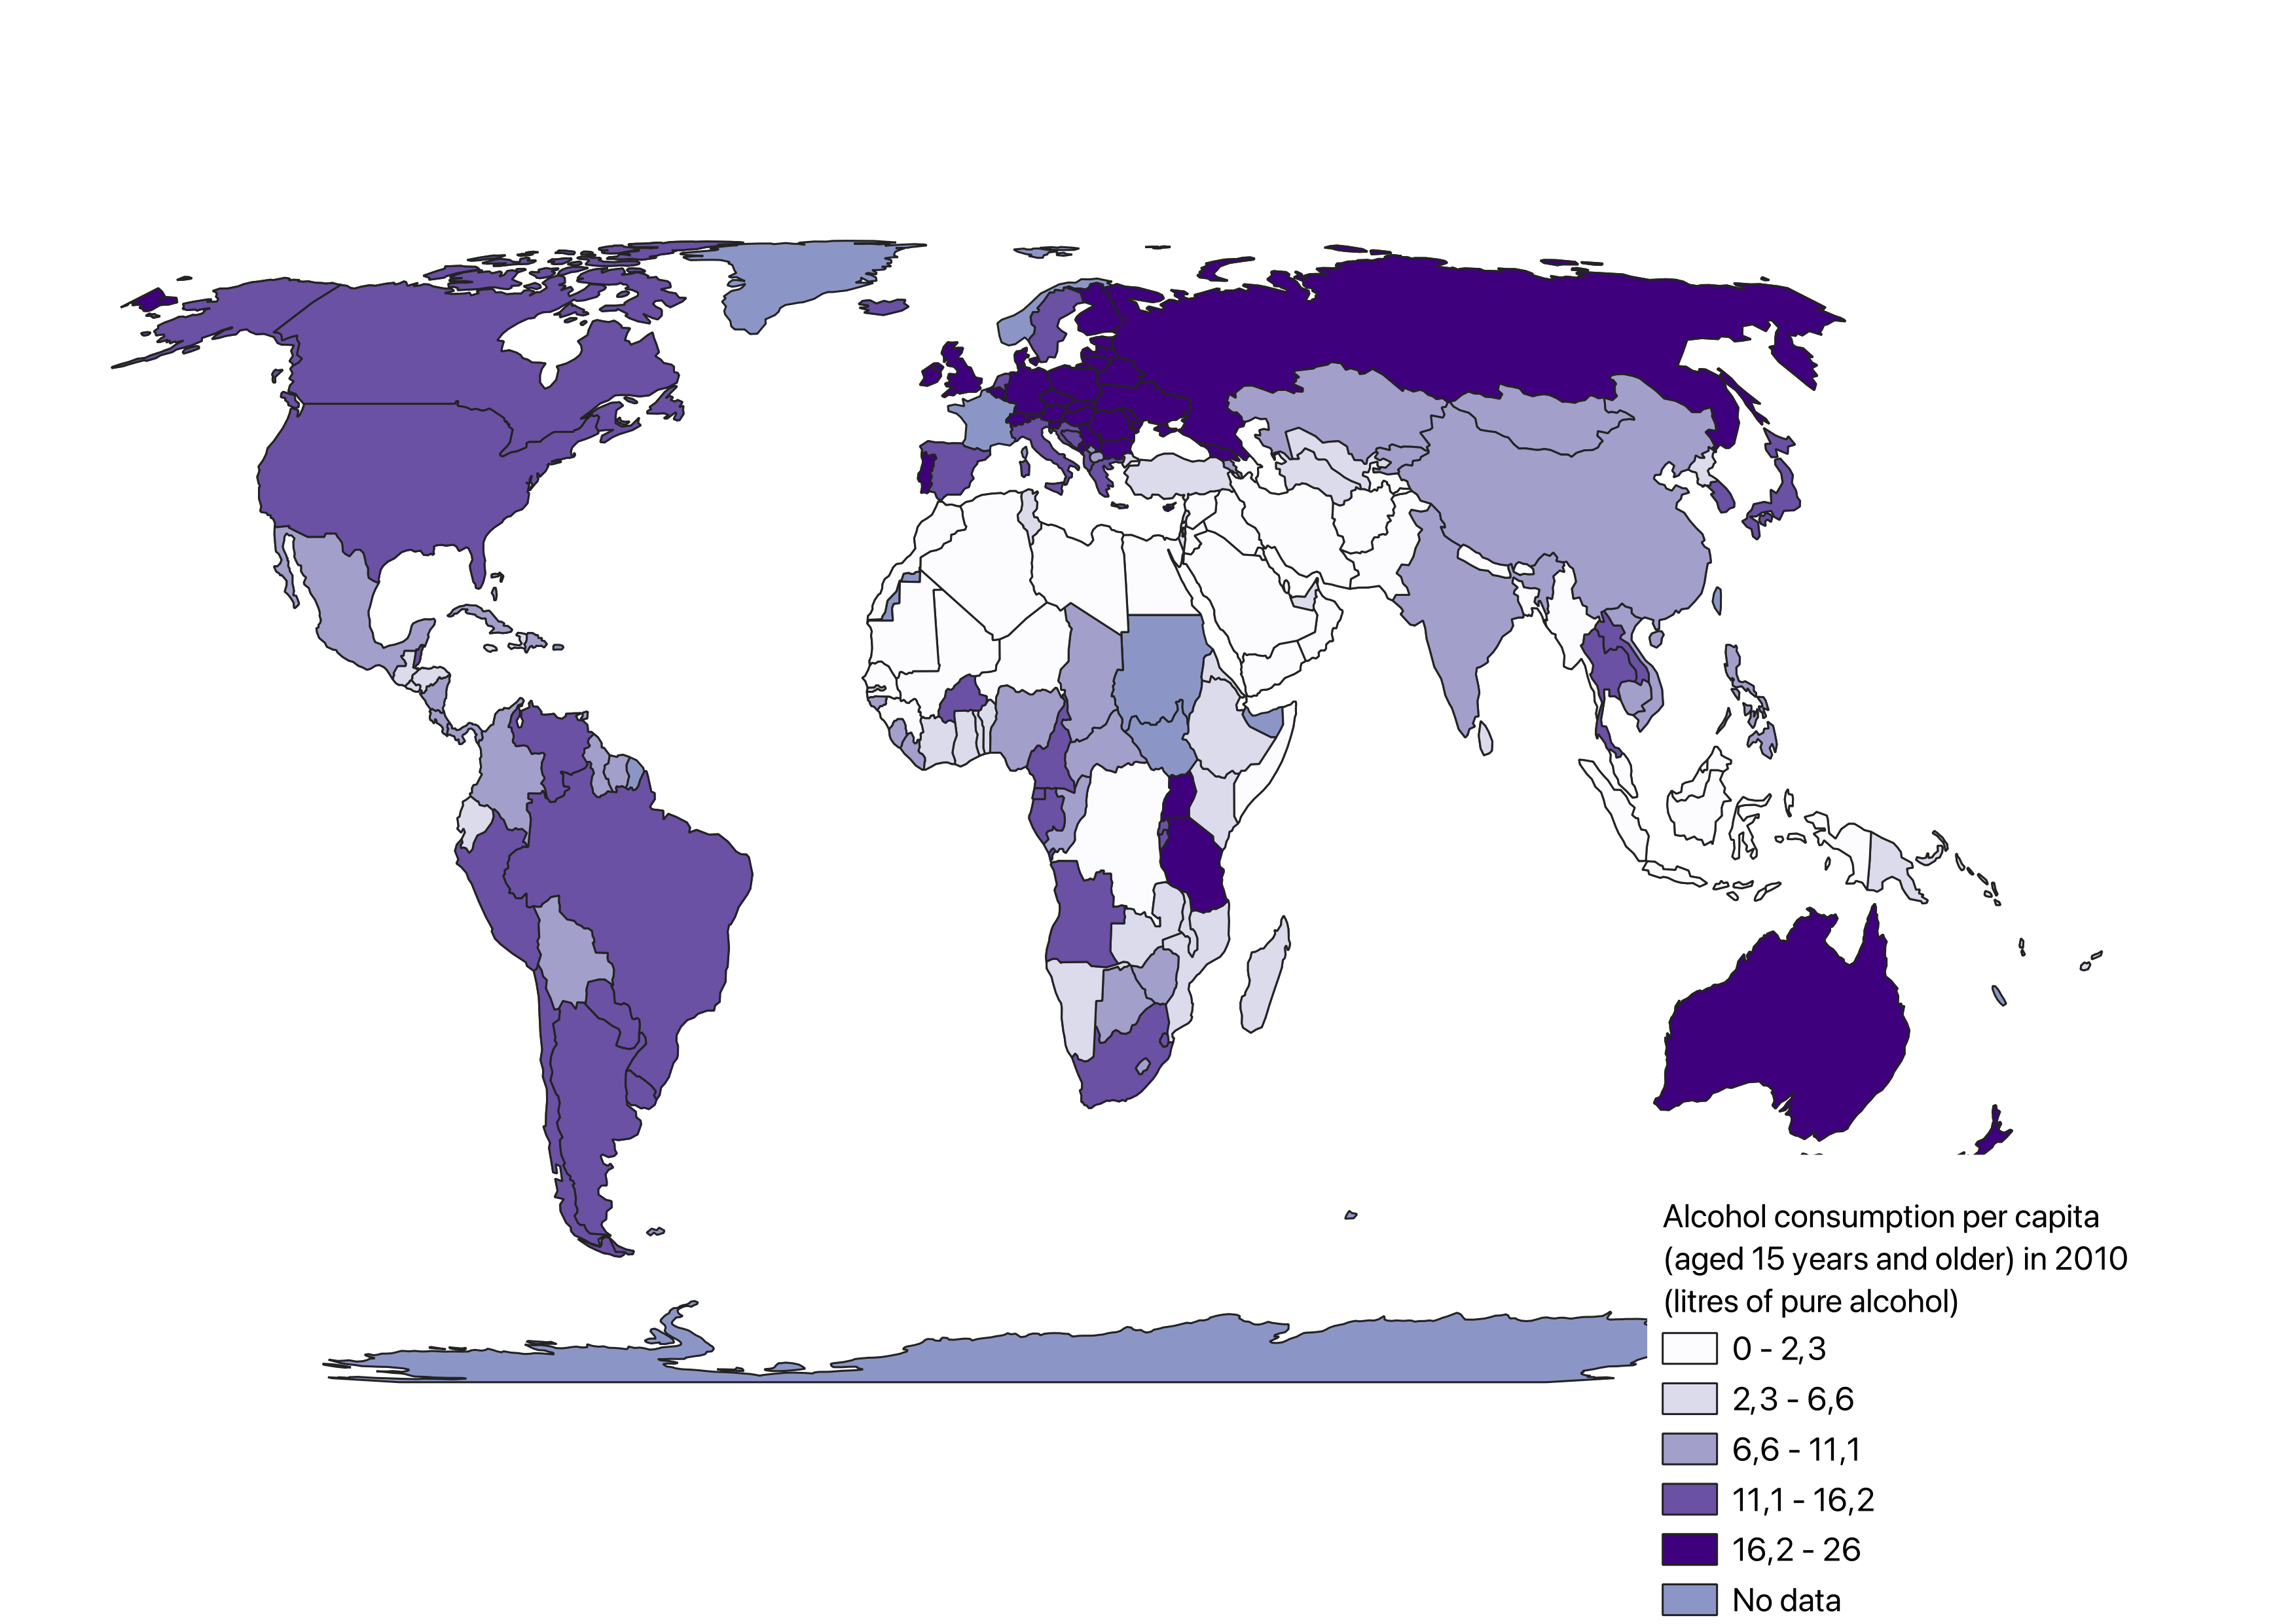
This choropleth map shows SDG indicator 3.5.2 “Alcohol per capita consumption (aged 15 years and older) in 2010 in liters of pure alcohol”. This indicator belongs to the overarching goal of “Good Health and Well-Being” (SDG 3). The map was made with QGIS and its data was derived from the UN Open-Source Data Hub. It is divided into five categories, ranging from 0 to 26 liters of pure alcohol consumption in a year. The five categories are all assigned a unique color, which makes it easy to analyze the map and compare countries. The darker the color of a country, the higher its general alcohol consumption.
Underneath the static version of this map, I present an interactive Esri Online map of this indicator. In Esri Online, users can interact with the map by clicking on the different country areas to explore further details surrounding the context. The legend can be viewed by clicking the button in the top right corner.